Cybersecurity Custom Report Feature
Giving Security Analysts Control Over Their Reports
Duration
Jun - Aug 2023 (10 Weeks)
Jun - Aug 2023 (10 Weeks)
Role
UX Design Intern
UX Design Intern
Reported to
Sr. Product Designer
Sr. Product Designer
CONTEXT
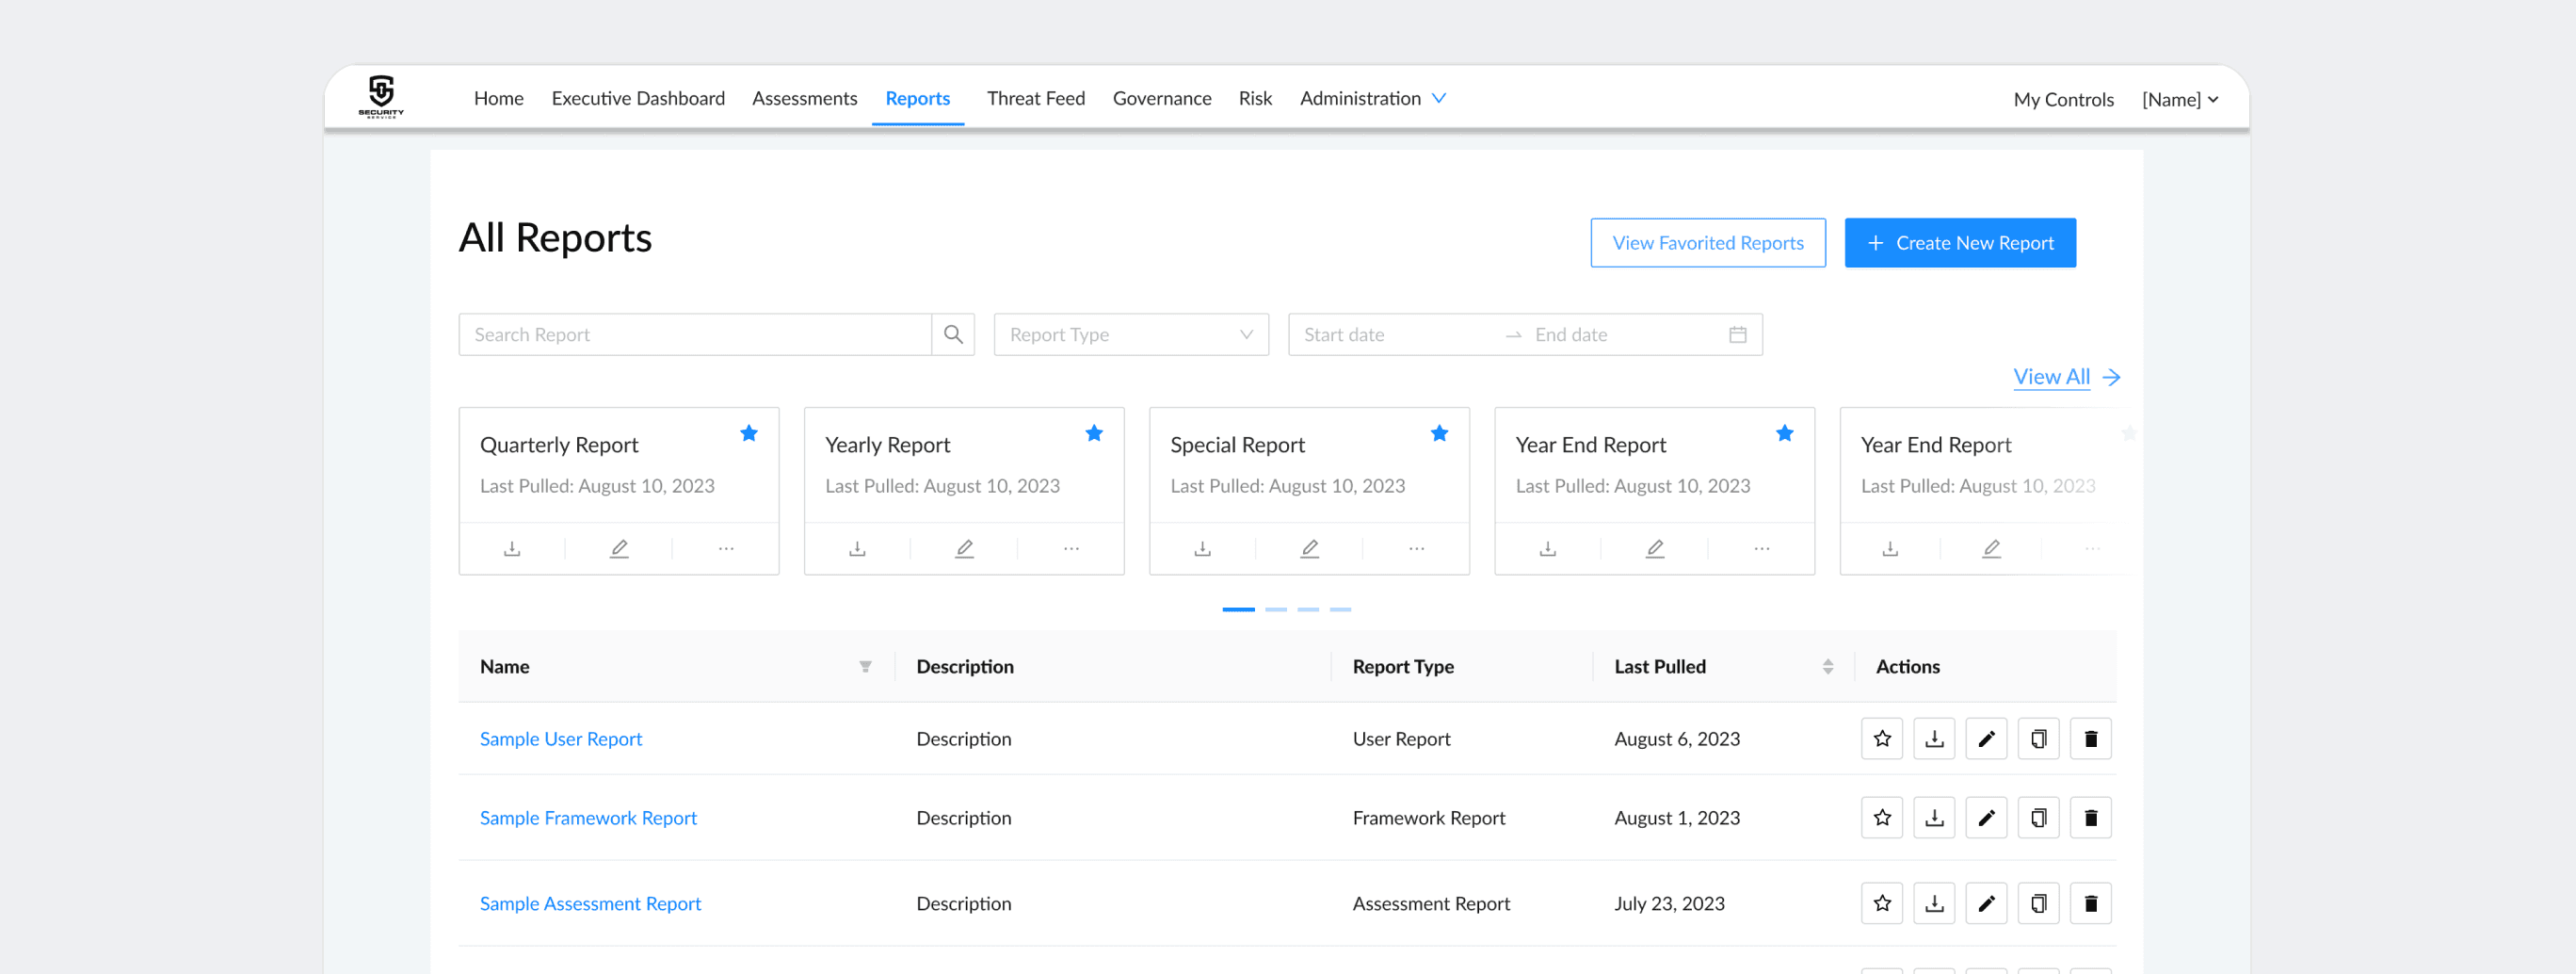
This cybersecurity platform helps analysts monitor security data and communicate findings through reports. I was brought in to redesign a core reporting workflow that clients relied on to share insights with different stakeholders.
CONTEXT
This cybersecurity platform helps analysts monitor security data and communicate findings through reports. I was brought in to redesign a core reporting workflow that clients relied on to share insights with different stakeholders.
CONTEXT
This cybersecurity platform helps analysts monitor security data and communicate findings through reports. I was brought in to redesign a core reporting workflow that clients relied on to share insights with different stakeholders.
PROBLEM
The reporting experience was too rigid for how clients actually worked. With only three predefined templates, users couldn’t customize fields, tailor reports for different audiences, or verify what a report contained before generating it.
"It feels like a guessing game... I'll download a report only to find some of the data I need missing and have to generate it all over again" - Client
70%
Client Dissatisfaction
An unreliable reporting tool undermines the trust the whole platform depends on, and for a Series A startup, client frustration at that scale is a churn risk they can't afford.
PROBLEM
The reporting experience was too rigid for how clients actually worked. With only three predefined templates, users couldn’t customize fields, tailor reports for different audiences, or verify what a report contained before generating it.
"It feels like a guessing game... I'll download a report only to find some of the data I need missing and have to generate it all over again" - Client
70%
Client Dissatisfaction
An unreliable reporting tool undermines the trust the whole platform depends on, and for a Series A startup, client frustration at that scale is a churn risk they can't afford.
PROBLEM
The reporting experience was too rigid for how clients actually worked. With only three predefined templates, users couldn’t customize fields, tailor reports for different audiences, or verify what a report contained before generating it.
"It feels like a guessing game... I'll download a report only to find some of the data I need missing and have to generate it all over again" - Client
70%
Client Dissatisfaction
An unreliable reporting tool undermines the trust the whole platform depends on, and for a Series A startup, client frustration at that scale is a churn risk they can't afford.
SOLUTION
A flexible reporting flow that lets clients see, customize, and reuse exactly the reports they need, replacing guesswork with control.
SOLUTION
A flexible reporting flow that lets clients see, customize, and reuse exactly the reports they need, replacing guesswork with control.
SOLUTION
A flexible reporting flow that lets clients see, customize, and reuse exactly the reports they need, replacing guesswork with control.

RESEARCH
I began by interviewing development, product, and customer success teams to understand client pain points, technical constraints, and business priorities. I then conducted two rounds of client interviews to learn how users generated reports, where their workflows broke down, and what control they needed. Together, this research defined the foundation for a solution that was both user-centered and technically feasible.
RESEARCH
I began by interviewing development, product, and customer success teams to understand client pain points, technical constraints, and business priorities. I then conducted two rounds of client interviews to learn how users generated reports, where their workflows broke down, and what control they needed. Together, this research defined the foundation for a solution that was both user-centered and technically feasible.
RESEARCH
I began by interviewing development, product, and customer success teams to understand client pain points, technical constraints, and business priorities. I then conducted two rounds of client interviews to learn how users generated reports, where their workflows broke down, and what control they needed. Together, this research defined the foundation for a solution that was both user-centered and technically feasible.
WHAT I FOUND OUT
Finding 1: Report generation was a black box
Users could only select from three predefined reports, and they couldn’t see what data they contained, change which fields appeared, or control the output format. Clicking a report immediately triggered a download, often forcing users to edit the resulting CSV manually or regenerate another report.

Finding 1: Report generation was a black box
Users could only select from three predefined reports, and they couldn’t see what data they contained, change which fields appeared, or control the output format. Clicking a report immediately triggered a download, often forcing users to edit the resulting CSV manually or regenerate another report.
Finding 1: Report generation was a black box
Users could only select from three predefined reports, and they couldn’t see what data they contained, change which fields appeared, or control the output format. Clicking a report immediately triggered a download, often forcing users to edit the resulting CSV manually or regenerate another report.
Finding 2: No control before generation
Without search or filters, users had to check assessments page by page. Report parameters couldn’t be adjusted, and the final output remained unknown until after download, which led to repeated report generation.

Finding 2: No control before generation
Without search or filters, users had to check assessments page by page. Report parameters couldn’t be adjusted, and the final output remained unknown until after download, which led to repeated report generation.
Finding 2: No control before generation
Without search or filters, users had to check assessments page by page. Report parameters couldn’t be adjusted, and the final output remained unknown until after download, which led to repeated report generation.
DESIGN SOLUTIONS
Instead of asking users to commit before knowing what they would receive, I designed the reporting experience around progressive control: choose a report, configure its contents, verify the output, then generate or save it.
DESIGN SOLUTIONS
Instead of asking users to commit before knowing what they would receive, I designed the reporting experience around progressive control: choose a report, configure its contents, verify the output, then generate or save it.
DESIGN SOLUTIONS
Instead of asking users to commit before knowing what they would receive, I designed the reporting experience around progressive control: choose a report, configure its contents, verify the output, then generate or save it.
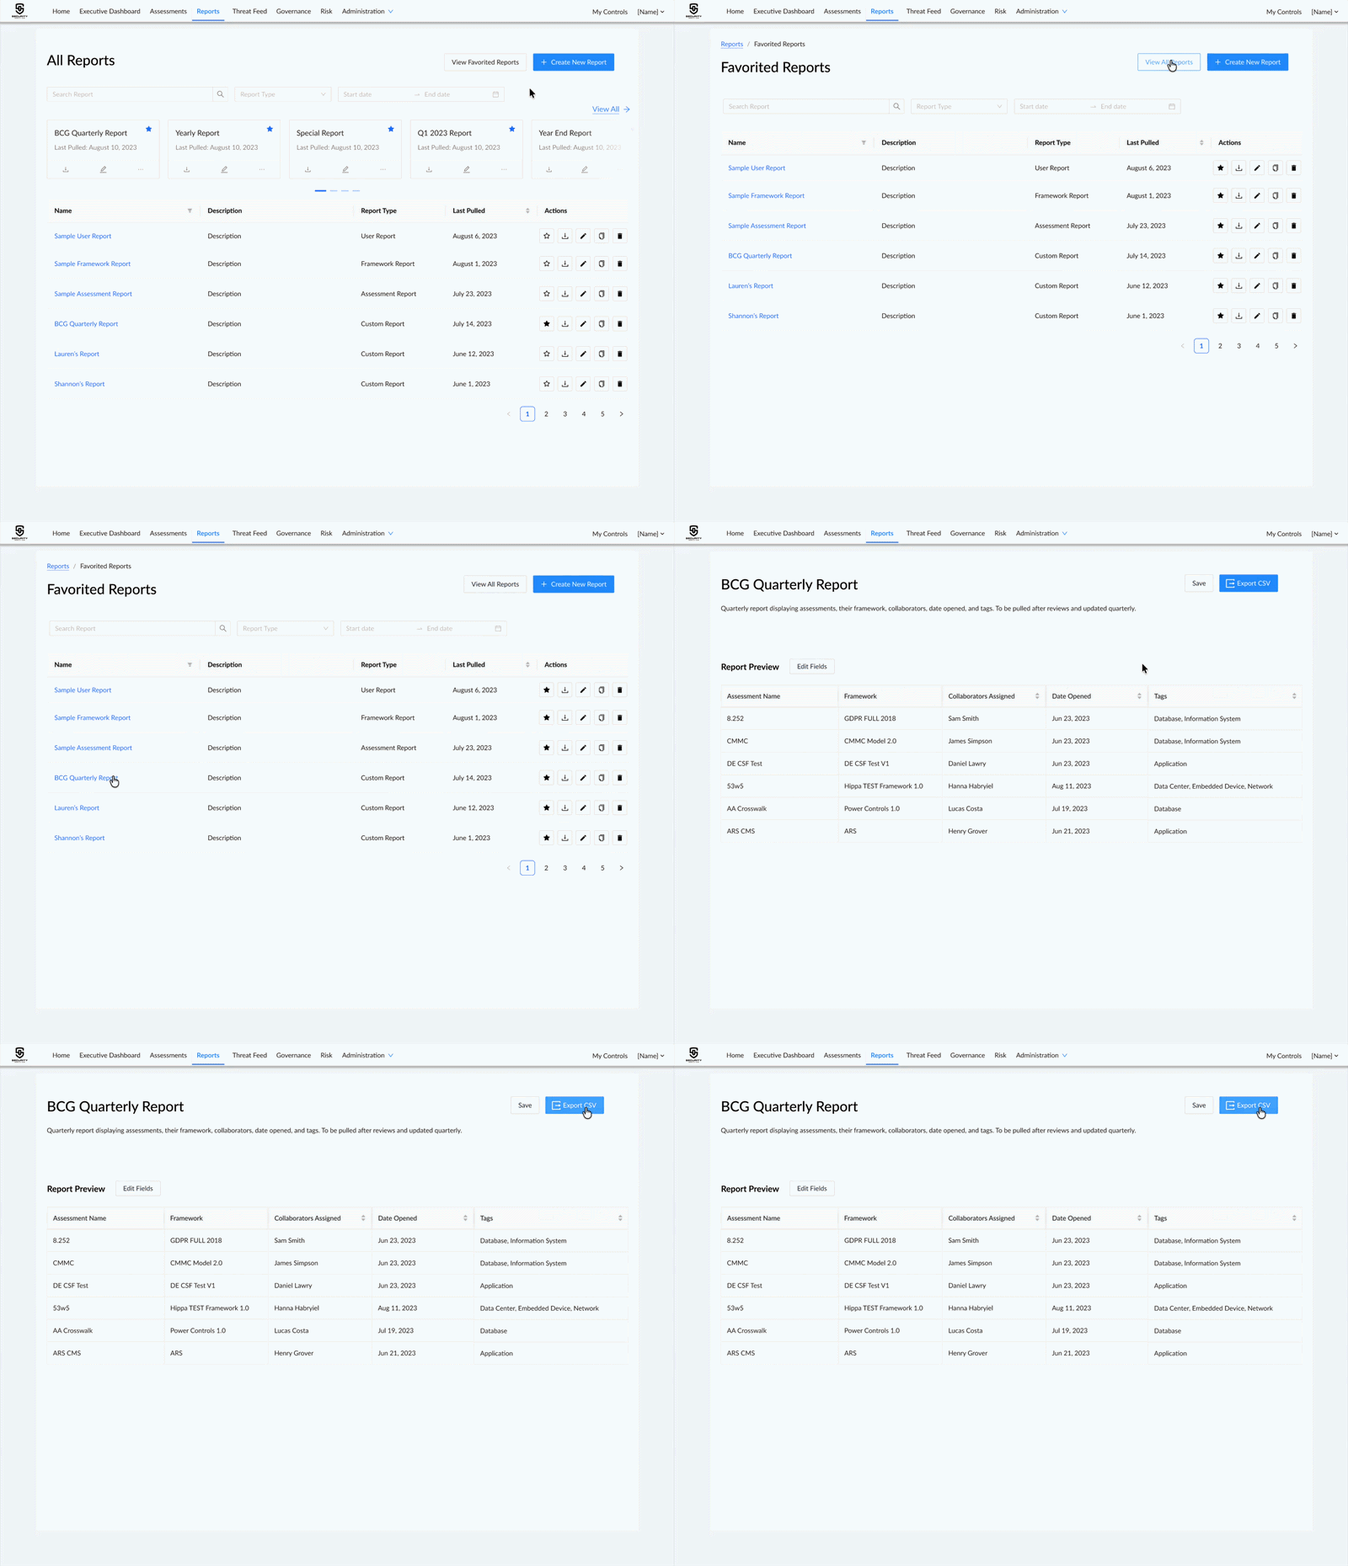
1. Report Management Hub
I replaced the report table landing page with a reporting hub that makes saved and recurring reports easy to find and manage.
1. Report Management Hub
I replaced the report table landing page with a reporting hub that makes saved and recurring reports easy to find and manage.
1. Report Management Hub
I replaced the report table landing page with a reporting hub that makes saved and recurring reports easy to find and manage.
2. Report Type Selection
I kept and added flexibility to existing report templates so returning users could continue using workflows they already understood, while also adding a new custom report flow that gives users maximum control when predetermined templates don't meet their needs.

2. Report Type Selection
I kept and added flexibility to existing report templates so returning users could continue using workflows they already understood, while also adding a new custom report flow that gives users maximum control when predetermined templates don't meet their needs.
2. Report Type Selection
I kept and added flexibility to existing report templates so returning users could continue using workflows they already understood, while also adding a new custom report flow that gives users maximum control when predetermined templates don't meet their needs.
3. A Guided Path to Full Report Control
The multi-step builder gives users control over their report without overwhelming them with every option at once, breaking a complex configuration process into clear, manageable decisions.

3. A Guided Path to Full Report Control
The multi-step builder gives users control over their report without overwhelming them with every option at once, breaking a complex configuration process into clear, manageable decisions.
3. A Guided Path to Full Report Control
The multi-step builder gives users control over their report without overwhelming them with every option at once, breaking a complex configuration process into clear, manageable decisions.
4. Field Selection
Users can select exactly which data points appear in a report, allowing the same underlying dataset to support different audiences. Filters help users quickly find relevant data without scanning an overwhelming list of fields, and a visible summary of selected fields helps users catch missing info before final generation.

4. Field Selection
Users can select exactly which data points appear in a report, allowing the same underlying dataset to support different audiences. Filters help users quickly find relevant data without scanning an overwhelming list of fields, and a visible summary of selected fields helps users catch missing info before final generation.
4. Field Selection
Users can select exactly which data points appear in a report, allowing the same underlying dataset to support different audiences. Filters help users quickly find relevant data without scanning an overwhelming list of fields, and a visible summary of selected fields helps users catch missing info before final generation.
5. Report Previews
5. Report Previews
Engineering constraints made a full report preview too resource-intensive, so I designed a lightweight preview that confirms the report’s structure and selected data without rendering the complete file.
Engineering constraints made a full report preview too resource-intensive, so I designed a lightweight preview that confirms the report’s structure and selected data without rendering the complete file.

VISUAL DESIGN
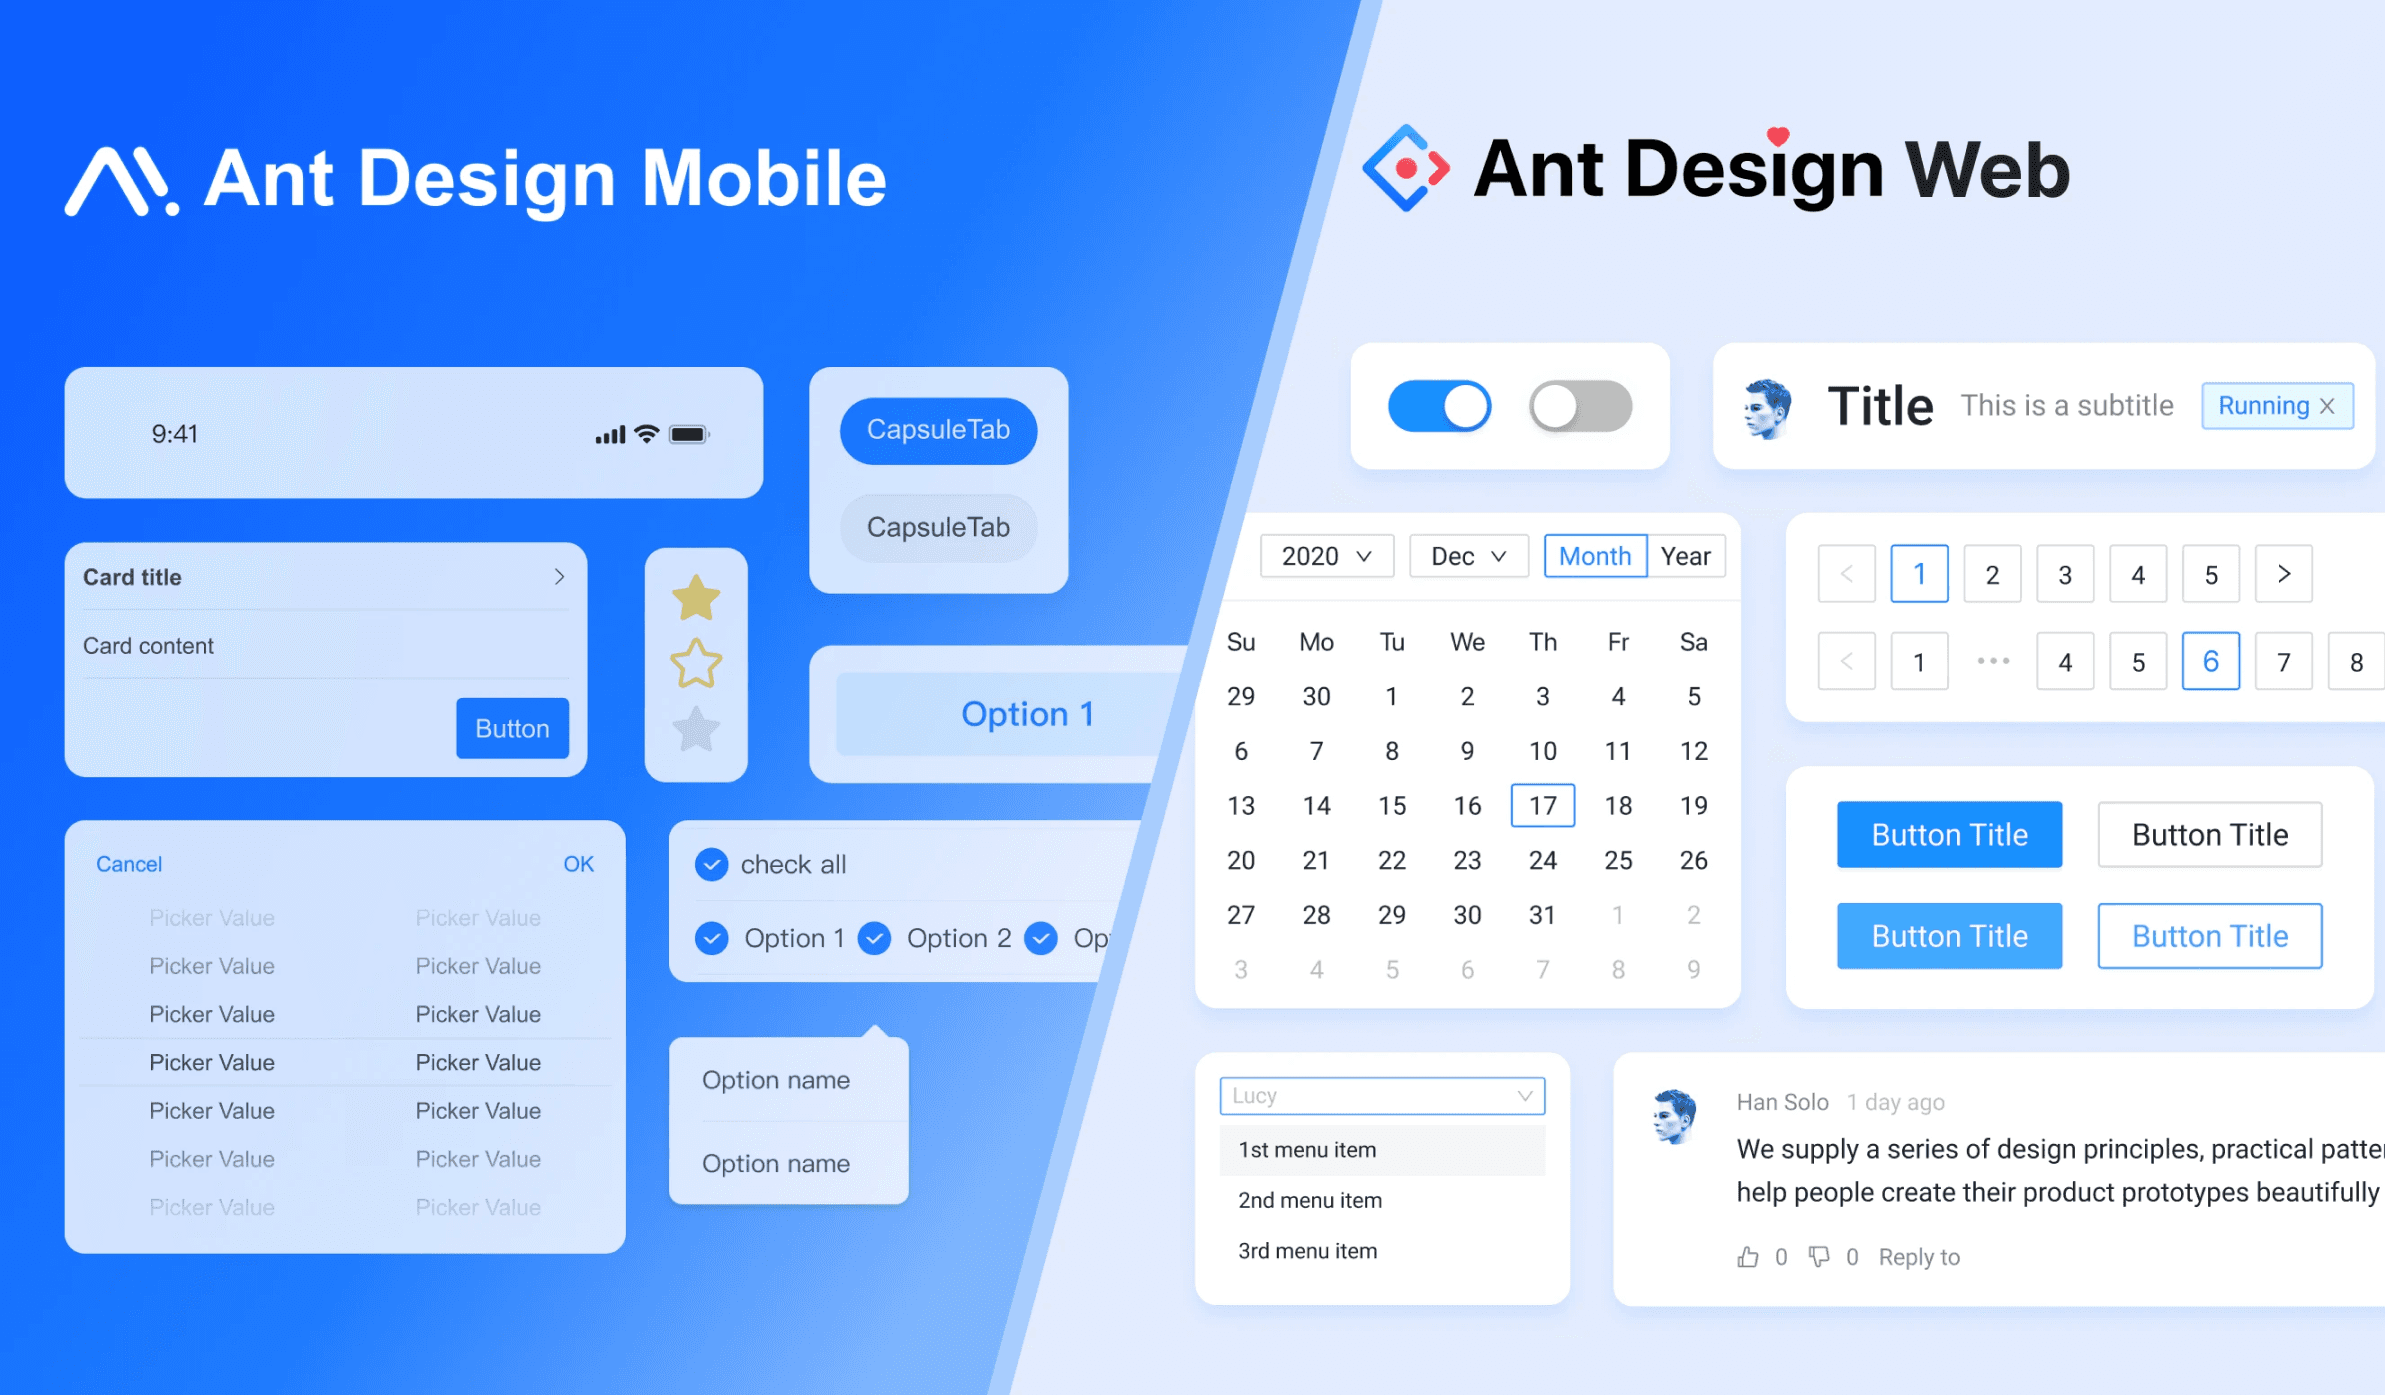
Built within Ant Design, this project challenged me to extend an existing design system rather than design from a blank canvas. I adapted familiar form and data-display patterns for new workflows while maintaining consistency across the platform. This process taught me to balance ideal UX with real-world constraints and design in a shared language with engineering.
VISUAL DESIGN
Built within Ant Design, this project challenged me to extend an existing design system rather than design from a blank canvas. I adapted familiar form and data-display patterns for new workflows while maintaining consistency across the platform. This process taught me to balance ideal UX with real-world constraints and design in a shared language with engineering.
VISUAL DESIGN
Built within Ant Design, this project challenged me to extend an existing design system rather than design from a blank canvas. I adapted familiar form and data-display patterns for new workflows while maintaining consistency across the platform. This process taught me to balance ideal UX with real-world constraints and design in a shared language with engineering.
OUTCOMES
<20s
<20s
To regenerate a saved report, down from 7+ min
To regenerate a saved report, down from 7+ min
0 → 1
0 → 1
Custom report flow built from scratch
Custom report flow built from scratch
3 flows
3 flows
Redesigned and optimized
Redesigned and optimized
I presented the final prototype to clients, executives, and the internal team, earning approval for implementation. Early alignment with engineering ensured a smooth handoff, and the feature ultimately shipped.
REFLECTIONS + LESSONS LEARNED
LESSONS
LEARNED
This project taught me how to turn an ambiguous, cross-functional problem into a shippable feature. If I continued the work, I'd validate the redesigned workflows with broader usability testing and establish success metrics around report creation time, regeneration, and adoption.
This project taught me how to turn an ambiguous, cross-functional problem into a shippable feature. If I continued the work, I'd validate the redesigned workflows with broader usability testing and establish success metrics around report creation time, regeneration, and adoption.
Constraints can improve the design.
Constraints can improve the design.
Working within Ant Design and technical constraints taught me to make intentional trade-offs while maintaining consistency across a complex product.
Connect perspectives.
Connect perspectives.
Combining input from clients, customer success, product, and engineering helped me design a solution that addressed real needs while remaining feasible to build.
Cybersecurity Custom Report Feature
Giving Security Analysts Control Over Their Reports
Duration
Jun - Aug 2023 (10 Weeks)
Jun - Aug 2023 (10 Weeks)
Role
UX Design Intern
UX Design Intern
Reported to
Sr. Product Designer
Sr. Product Designer
CONTEXT
This cybersecurity platform helps analysts monitor security data and communicate findings through reports. I was brought in to redesign a core reporting workflow that clients relied on to share insights with different stakeholders.
CONTEXT
This cybersecurity platform helps analysts monitor security data and communicate findings through reports. I was brought in to redesign a core reporting workflow that clients relied on to share insights with different stakeholders.
CONTEXT
This cybersecurity platform helps analysts monitor security data and communicate findings through reports. I was brought in to redesign a core reporting workflow that clients relied on to share insights with different stakeholders.
PROBLEM
The reporting experience was too rigid for how clients actually worked. With only three predefined templates, users couldn’t customize fields, tailor reports for different audiences, or verify what a report contained before generating it.
"It feels like a guessing game... I'll download a report only to find some of the data I need missing and have to generate it all over again" - Client
70%
Client Dissatisfaction
An unreliable reporting tool undermines the trust the whole platform depends on, and for a Series A startup, client frustration at that scale is a churn risk they can't afford.
PROBLEM
The reporting experience was too rigid for how clients actually worked. With only three predefined templates, users couldn’t customize fields, tailor reports for different audiences, or verify what a report contained before generating it.
"It feels like a guessing game... I'll download a report only to find some of the data I need missing and have to generate it all over again" - Client
70%
Client Dissatisfaction
An unreliable reporting tool undermines the trust the whole platform depends on, and for a Series A startup, client frustration at that scale is a churn risk they can't afford.
PROBLEM
The reporting experience was too rigid for how clients actually worked. With only three predefined templates, users couldn’t customize fields, tailor reports for different audiences, or verify what a report contained before generating it.
"It feels like a guessing game... I'll download a report only to find some of the data I need missing and have to generate it all over again" - Client
70%
Client Dissatisfaction
An unreliable reporting tool undermines the trust the whole platform depends on, and for a Series A startup, client frustration at that scale is a churn risk they can't afford.
SOLUTION
A flexible reporting flow that lets clients see, customize, and reuse exactly the reports they need, replacing guesswork with control.
SOLUTION
A flexible reporting flow that lets clients see, customize, and reuse exactly the reports they need, replacing guesswork with control.
SOLUTION
A flexible reporting flow that lets clients see, customize, and reuse exactly the reports they need, replacing guesswork with control.
RESEARCH
I began by interviewing development, product, and customer success teams to understand client pain points, technical constraints, and business priorities. I then conducted two rounds of client interviews to learn how users generated reports, where their workflows broke down, and what control they needed. Together, this research defined the foundation for a solution that was both user-centered and technically feasible.
RESEARCH
I began by interviewing development, product, and customer success teams to understand client pain points, technical constraints, and business priorities. I then conducted two rounds of client interviews to learn how users generated reports, where their workflows broke down, and what control they needed. Together, this research defined the foundation for a solution that was both user-centered and technically feasible.
RESEARCH
I began by interviewing development, product, and customer success teams to understand client pain points, technical constraints, and business priorities. I then conducted two rounds of client interviews to learn how users generated reports, where their workflows broke down, and what control they needed. Together, this research defined the foundation for a solution that was both user-centered and technically feasible.
WHAT I FOUND OUT
Finding 1: Report generation was a black box
Users could only select from three predefined reports, and they couldn’t see what data they contained, change which fields appeared, or control the output format. Clicking a report immediately triggered a download, often forcing users to edit the resulting CSV manually or regenerate another report.
Finding 1: Report generation was a black box
Users could only select from three predefined reports, and they couldn’t see what data they contained, change which fields appeared, or control the output format. Clicking a report immediately triggered a download, often forcing users to edit the resulting CSV manually or regenerate another report.
Finding 1: Report generation was a black box
Users could only select from three predefined reports, and they couldn’t see what data they contained, change which fields appeared, or control the output format. Clicking a report immediately triggered a download, often forcing users to edit the resulting CSV manually or regenerate another report.
Finding 2: No control before generation
Without search or filters, users had to check assessments page by page. Report parameters couldn’t be adjusted, and the final output remained unknown until after download, which led to repeated report generation.
Finding 2: No control before generation
Without search or filters, users had to check assessments page by page. Report parameters couldn’t be adjusted, and the final output remained unknown until after download, which led to repeated report generation.
Finding 2: No control before generation
Without search or filters, users had to check assessments page by page. Report parameters couldn’t be adjusted, and the final output remained unknown until after download, which led to repeated report generation.
DESIGN SOLUTIONS
Instead of asking users to commit before knowing what they would receive, I designed the reporting experience around progressive control: choose a report, configure its contents, verify the output, then generate or save it.
DESIGN SOLUTIONS
Instead of asking users to commit before knowing what they would receive, I designed the reporting experience around progressive control: choose a report, configure its contents, verify the output, then generate or save it.
DESIGN SOLUTIONS
Instead of asking users to commit before knowing what they would receive, I designed the reporting experience around progressive control: choose a report, configure its contents, verify the output, then generate or save it.
1. Report Management Hub
I replaced the report table landing page with a reporting hub that makes saved and recurring reports easy to find and manage.
1. Report Management Hub
I replaced the report table landing page with a reporting hub that makes saved and recurring reports easy to find and manage.
1. Report Management Hub
I replaced the report table landing page with a reporting hub that makes saved and recurring reports easy to find and manage.
2. Report Type Selection
I kept and added flexibility to existing report templates so returning users could continue using workflows they already understood, while also adding a new custom report flow that gives users maximum control when predetermined templates don't meet their needs.
2. Report Type Selection
I kept and added flexibility to existing report templates so returning users could continue using workflows they already understood, while also adding a new custom report flow that gives users maximum control when predetermined templates don't meet their needs.
2. Report Type Selection
I kept and added flexibility to existing report templates so returning users could continue using workflows they already understood, while also adding a new custom report flow that gives users maximum control when predetermined templates don't meet their needs.
3. A Guided Path to Full Report Control
The multi-step builder gives users control over their report without overwhelming them with every option at once, breaking a complex configuration process into clear, manageable decisions.
3. A Guided Path to Full Report Control
The multi-step builder gives users control over their report without overwhelming them with every option at once, breaking a complex configuration process into clear, manageable decisions.
3. A Guided Path to Full Report Control
The multi-step builder gives users control over their report without overwhelming them with every option at once, breaking a complex configuration process into clear, manageable decisions.
4. Field Selection
Users can select exactly which data points appear in a report, allowing the same underlying dataset to support different audiences. Filters help users quickly find relevant data without scanning an overwhelming list of fields, and a visible summary of selected fields helps users catch missing info before final generation.
4. Field Selection
Users can select exactly which data points appear in a report, allowing the same underlying dataset to support different audiences. Filters help users quickly find relevant data without scanning an overwhelming list of fields, and a visible summary of selected fields helps users catch missing info before final generation.
4. Field Selection
Users can select exactly which data points appear in a report, allowing the same underlying dataset to support different audiences. Filters help users quickly find relevant data without scanning an overwhelming list of fields, and a visible summary of selected fields helps users catch missing info before final generation.
5. Report Previews
5. Report Previews
Engineering constraints made a full report preview too resource-intensive, so I designed a lightweight preview that confirms the report’s structure and selected data without rendering the complete file.
Engineering constraints made a full report preview too resource-intensive, so I designed a lightweight preview that confirms the report’s structure and selected data without rendering the complete file.
VISUAL DESIGN
Built within Ant Design, this project challenged me to extend an existing design system rather than design from a blank canvas. I adapted familiar form and data-display patterns for new workflows while maintaining consistency across the platform. This process taught me to balance ideal UX with real-world constraints and design in a shared language with engineering.
VISUAL DESIGN
Built within Ant Design, this project challenged me to extend an existing design system rather than design from a blank canvas. I adapted familiar form and data-display patterns for new workflows while maintaining consistency across the platform. This process taught me to balance ideal UX with real-world constraints and design in a shared language with engineering.
VISUAL DESIGN
Built within Ant Design, this project challenged me to extend an existing design system rather than design from a blank canvas. I adapted familiar form and data-display patterns for new workflows while maintaining consistency across the platform. This process taught me to balance ideal UX with real-world constraints and design in a shared language with engineering.
OUTCOMES
<20s
<20s
To regenerate a saved report, down from 7+ min
To regenerate a saved report, down from 7+ min
0 → 1
0 → 1
Custom report flow built from scratch
Custom report flow built from scratch
3 flows
3 flows
Redesigned and optimized
Redesigned and optimized
I presented the final prototype to clients, executives, and the internal team, earning approval for implementation. Early alignment with engineering ensured a smooth handoff, and the feature ultimately shipped.
REFLECTIONS + LESSONS LEARNED
LESSONS
LEARNED
This project taught me how to turn an ambiguous, cross-functional problem into a shippable feature. If I continued the work, I'd validate the redesigned workflows with broader usability testing and establish success metrics around report creation time, regeneration, and adoption.
This project taught me how to turn an ambiguous, cross-functional problem into a shippable feature. If I continued the work, I'd validate the redesigned workflows with broader usability testing and establish success metrics around report creation time, regeneration, and adoption.
Constraints can improve the design.
Constraints can improve the design.
Working within Ant Design and technical constraints taught me to make intentional trade-offs while maintaining consistency across a complex product.
Connect perspectives.
Connect perspectives.
Combining input from clients, customer success, product, and engineering helped me design a solution that addressed real needs while remaining feasible to build.